While in LA last month we went to an opening at Prism Gallery for Australian artist Jonathan Zawada’s work. Though I have never been charmed by landscape art, Zawada’s vibrant colors and conceptual graphs that accompanied the paintings magnetized my attention. Looking more closely at the graphs and then back at the paintings I saw that this artist inspiration was born from a great amount of social study. I had the chance to interview him on his work below…

> Why landscapes?
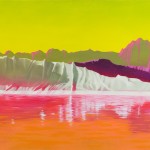
Initially the concept for this body of work came out of work I had produced for a previous show which revolved around ideas of boolean information abstractions and broached elements of fractal self-similarities. I really wanted to explore the ideas of how something could be not just visually and structurally self-similar in a fractal way but also be self-similar in terms of a visual expression of its information content. This lead to the realization that the silhouette of a mountain range can be read as a line graph. There is also something about the familiarity of landscape paintings which seemed to me to be a good fit with the aim I had of representing my daily virtual experiences in a concrete visual way.
> What is the correlation between the info graphs and the landscape paintings?
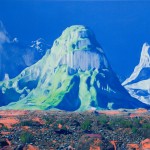
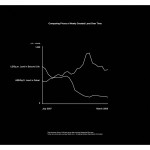
The works began by accruing as much disparate data as I could find from online sources and generating graphs from different combinations of comparisons of the data. I then used these graphs to generate and render virtual landscapes with 3d modelling software so that the silhouettes of the mountain ranges matched the lines in the graphs.


> How did you come up with the concept of these info graphs and the things they represent?
There are a number of works in the show which are based on data revolving around parallels between virtual and real-world information, things like the cost of land in the online world Second Life and the cost of land in Dubai over the same two year period. They aimed to create a stronger bond between transient virtual experiences and their real world counter-parts. Most of the data was simply collected to be as broad a spectrum of time spans as I could find within a human context though, time periods as short as that of the visible light spectrum and as long as the the existence of the Caterpillar machinery company.

> Why the choice of such a vibrant palette, what is that a reference to?
Being representations of abstracted data and thus of virtual experiences I really wanted the landscapes to follow the rules of light and shadow and atmosphere that are at play in the real world but I also wanted them to allude to their unreal foundations and also to the virtual environments of online worlds like World of Warcraft and even something like Super Mario Bros.

> How long did it take you to create this body of work?
The painting and illustrations took about 3 months to produce while the data collection and 3d modeling stages probably took another couple of months. All up, from start to finish I’d say it was about 6 months of work (interspersed with periods of downtime working on my day job trying to pay the bills).